Introduction to
Piloting
PLT 101
Exam Question? Using latitude, longitude, VOR/DME, and altitude, determine if you are currently flying above, in, or under the class B airspace at LAX?
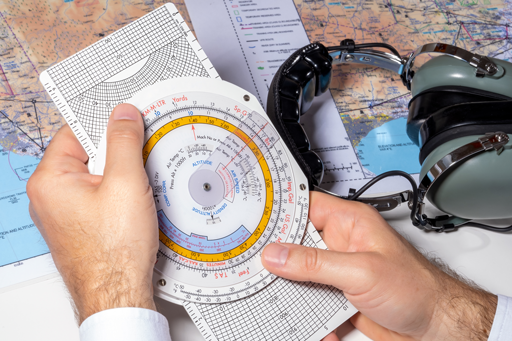
Situational awareness is not only important for the pilot, but also for the serious Flight Data Analyst. In PLT 101, you will fly a real time aircraft simulator while integrating various flight operations constraints, maneuvers, piloting techniques, FAA/EASA/ICAO regulations, and ATC directives into your lesson – ALL designed to convert you from an analyst into a pilot. During this intensive 5 day class, you will embrace airspace classifications, stalls and spins, attitude upset recovery, stable & unstable approaches, flight instrument scanning and interpretation, communications/radar services, VFR chart usage, and even the finer elements of takeoffs and landings. Midway through the course, you will perform with minimal instructor assistance, collision avoidance procedures, radio communication management, and night flying. You’ll gain insight into safety precautions and decision theory required for managing potential flight risks, including a deep dive into system failure response and recovery procedures. Sign up now and boost your flight data analytcial skills!
Become a Pilot and seasoned Flight Data Analyst at the same time!
Performance Awareness
Temperature, gross weight, runway conditions, wind speed/direction, humidity, pressure, and various environmental dynamics can all affect aircraft performance, which in turn play a major part in the aircraft’s obstacle clearance capability. Gain aptitude in performance analysis by merging environmental factors and constraints with flight data.
Airspace Analytics
Airspace can be divided in class A, B, C, D, E & G. In PLT 101 you will not only master airspace classifications, but you will also become proficient in detecting airspace regions based on the aircraft’s real time position.
Visual Interpretation
Stalls, runway misalignment, diversions, TCAS collission avoidance maneuvers, and several other unusual configuration and recovery events are often hidden from the flight data analyst. Stand out from the rest by acquiring competence in flight data visual interpretation – a goal reached via intentional inducement of specific operational events, followed by a deep study in abnormal ops detection.

“Well here we go again. ATC stated we violated the class C airspace at 0931 am. For sure we were within limits! I wish had some hard core flight data and the ability to analyze the data in order to support our case!”
“To be honest with you, I was taken aback by the intensity of this course. Through Flight Data X’s masterful approach to teaching, I felt like I was airborne in the cockpit of the class the whole time, while simultaneously performing data analysis from the output of the sim. There was an unbelievable amount of real time high-tech technology applied in class. Can you believe actual air traffic controllers were communicating with us over the sim radios during the flight!!! In fact, I found myself sweating at times, due to the amount of stress I experienced managing radios and responding to system failures, especially while flying in the middle of the night with poor visibility. I can honestly say that I have completed one of my goals for sure. Previously I was just a basic flight data analyst viewing graphs and tabular data, but now I know how to connect the dots between actual inflight pilot activity, ops procedures, and flight data analytics…well at least at the basic level for now. This is cutting edge stuff, so I definitely plan on enrolling in PLT 201 and 301 in order to take this learning experience to the next level”
Ibn Navajo
Flight Data Analyst
Aircraft Accident Investigation Consultant


